

Multi-Agent Sessions
Multi-Agent Sessions reconstruct a single multi-agent run as one interactive timeline — every participating agent, every handoff between them, every governance verdict, and every message exchanged.
It answers questions like:
- Which agent ran when, and for how long?
- Where did one agent hand off to another?
- What did each agent actually say or call?
- Did any activity fail?
Where to find it
- Click Organization in the sidebar (the page opens on the Teams tab)
- Click the eye icon on a team row to open its detail page
- Select the Agents tab
- Scroll past the agent list — Multi-Agent Sessions renders below
If your organization doesn't have Multi-Agent Sessions enabled, this view won't appear at all — contact your OpenBox admin. If the view is enabled but the team has no runs yet, the run selector renders empty.
Picking a run
A dropdown at the top lists the team's 50 most recent multi-agent runs, newest first:
May 13, 2026, 6:27 PM · 5 agents · Completed
Each entry shows the end time (or start time if still running), the number of agents that participated, and the final status (Running, Completed, or Failed).
Selecting a run loads its full timeline. The view is a snapshot — nothing updates in the background while you're watching. Reload the page to see new activity for an in-progress run.

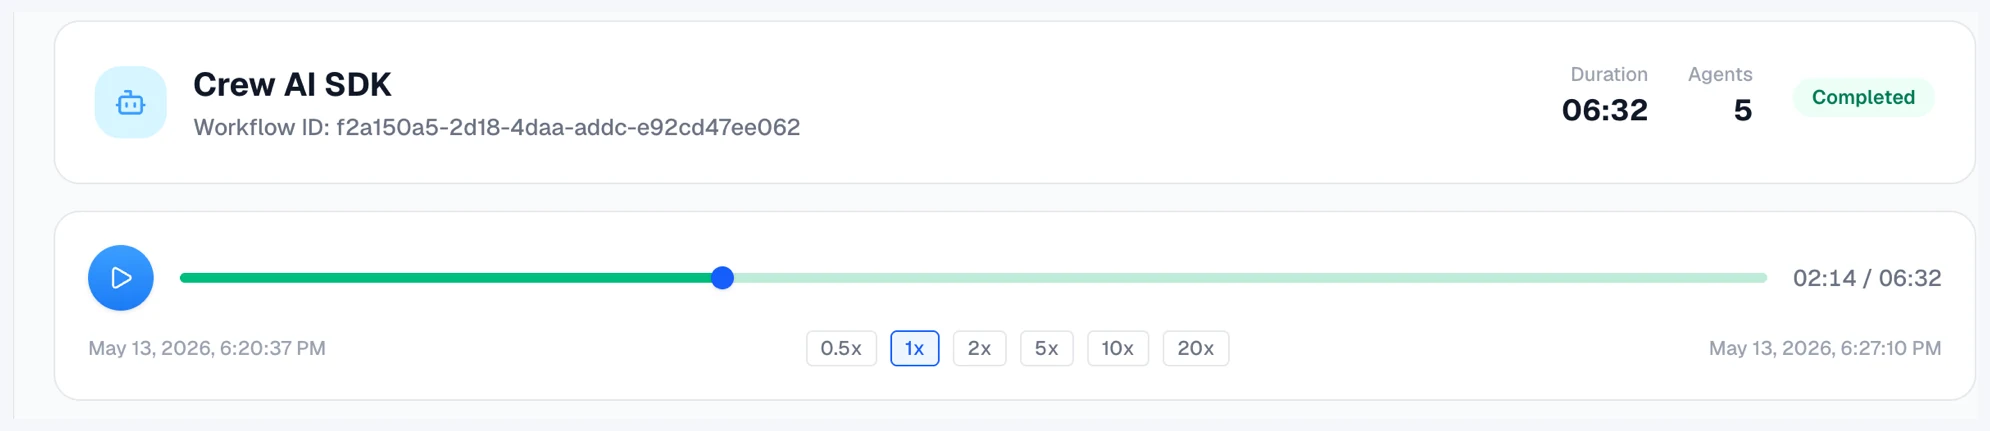
Header
Above the timeline:
| Element | Meaning |
|---|---|
| Run name | Team name (the run inherits its label from the team it belongs to) |
| Workflow ID | Unique identifier for this run, shown below the name |
| Duration | Wall-clock time from the run's first session start to its last session completion |
| Agents | Number of agents that participated in the run |
| Status badge | Running, Completed, or Failed |
Player bar
Drives playback across the timeline.
- Play / pause — animates the timeline cursor forward
- Speed selector —
0.5x,1x,2x,5x,10x,20x - Scrubber — click or drag to seek to any moment in the run
The graph and event stream both react to the cursor: nodes and bars highlight as their corresponding activity becomes "current".
Agent graph
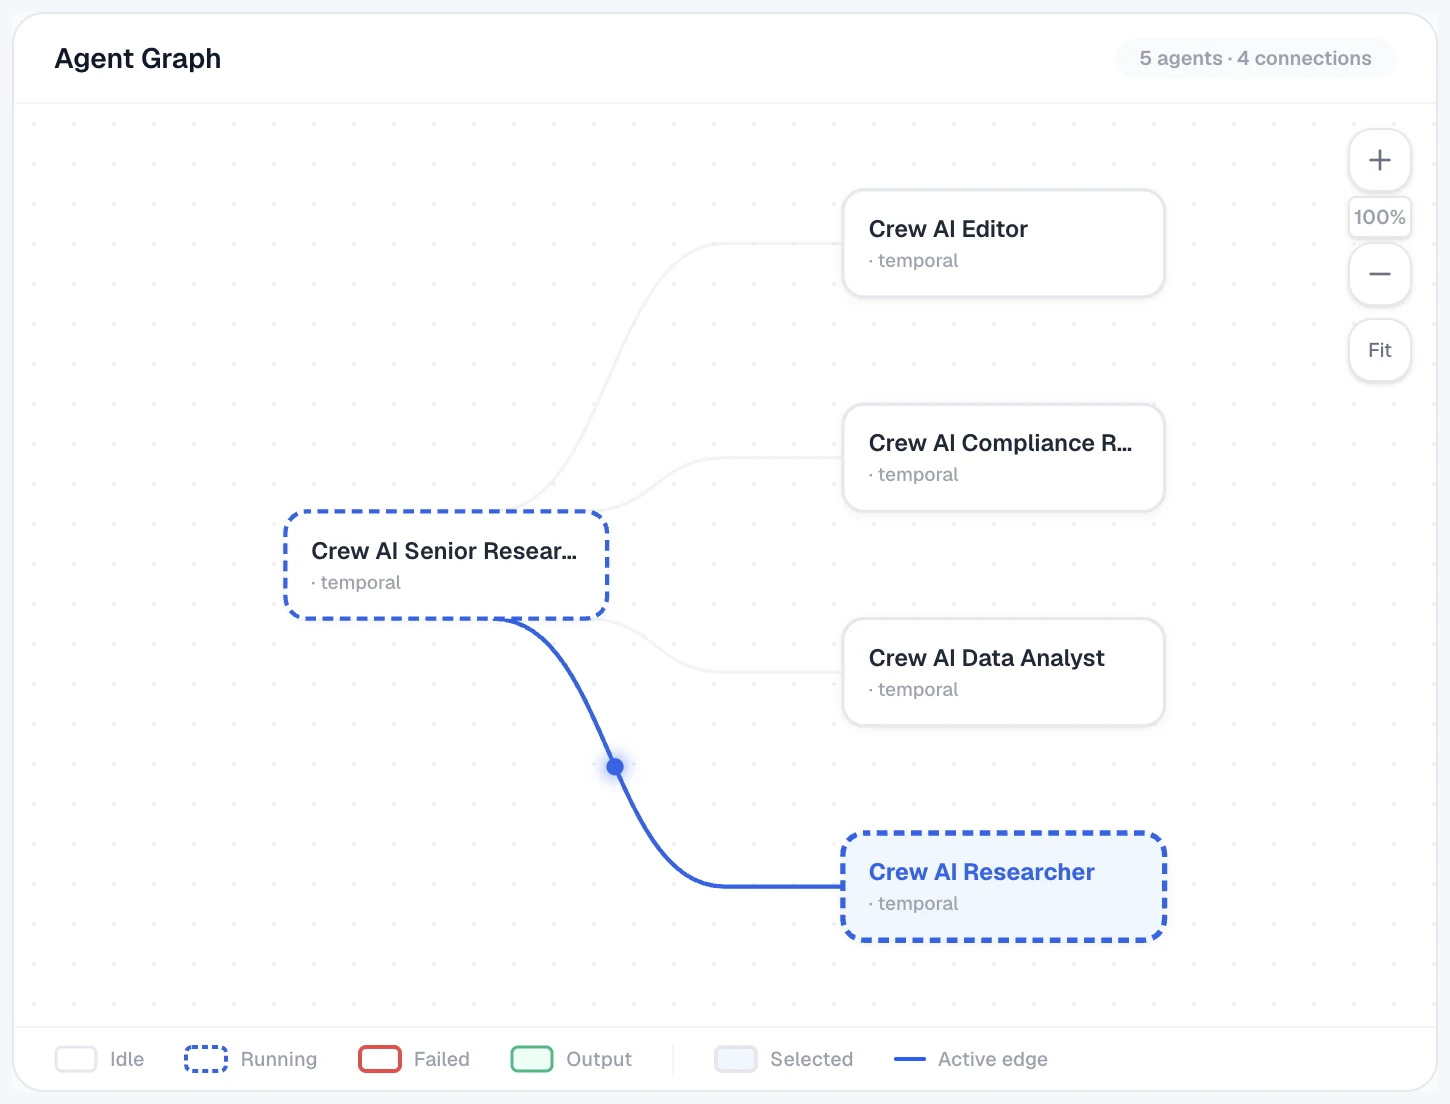
A directed graph of the agents in the run.
- Nodes — one per agent, labelled with the agent name (truncated with an ellipsis if long). The node border encodes the agent's current state:
- Idle — plain border
- Running — dashed blue border (the agent is active at the cursor position)
- Failed — red border (any activity for this agent failed)
- Output — green border and green fill (the agent producing the run's final output)
- Selected — blue background fill
- Edges — handoffs from one agent to another. Animated balls travel along the edge in playback to show the direction and timing of each handoff. An Active edge highlights blue when the handoff is current.
The graph has its own zoom controls — +, −, and Fit buttons in the top right, with the current zoom percentage displayed between them.
Clicking a node selects that agent and populates the detail pane on the right.
Event stream
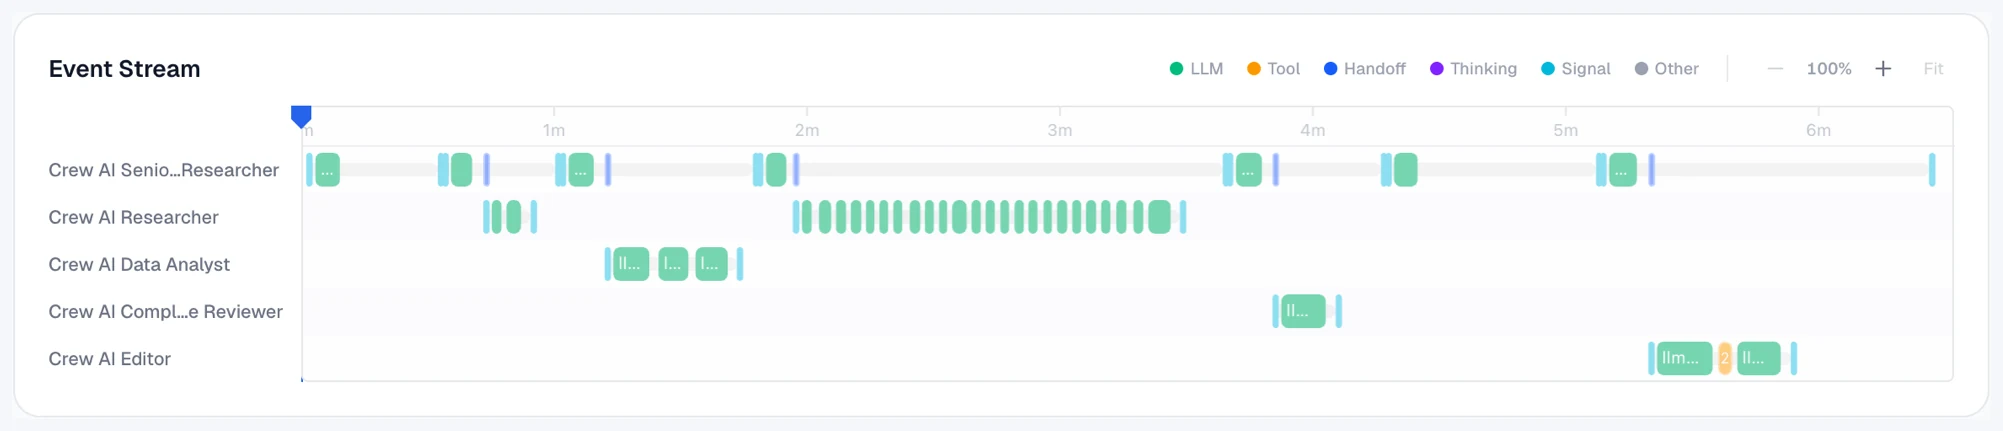
A canvas-based timeline below the graph, with one row per agent. Each row shows bars for that agent's activities, colour-coded by type:
| Type | Colour | Bar represents |
|---|---|---|
| LLM | Green | LLM completion call |
| Tool | Amber | Tool invocation (including MCP, HTTP, DB, file calls) |
| Handoff | Blue | Transfer of control to another agent |
| Thinking | Violet | Internal reasoning step |
| Signal | Cyan | External signal received |
| Other | Grey | Activity type the view doesn't recognise |
Any failed activity renders as a red bar regardless of its underlying type.
Interactions:
- Zoom — hold Ctrl (or Cmd on macOS) and scroll the mouse wheel, or use the
–/+/Fitcontrols in the top right of the stream - Pan — horizontal trackpad scroll (only meaningful when zoomed in)
- Seek — drag along the timeline track, or click a bar to jump the cursor to that activity and pin the detail pane to it
Detail pane
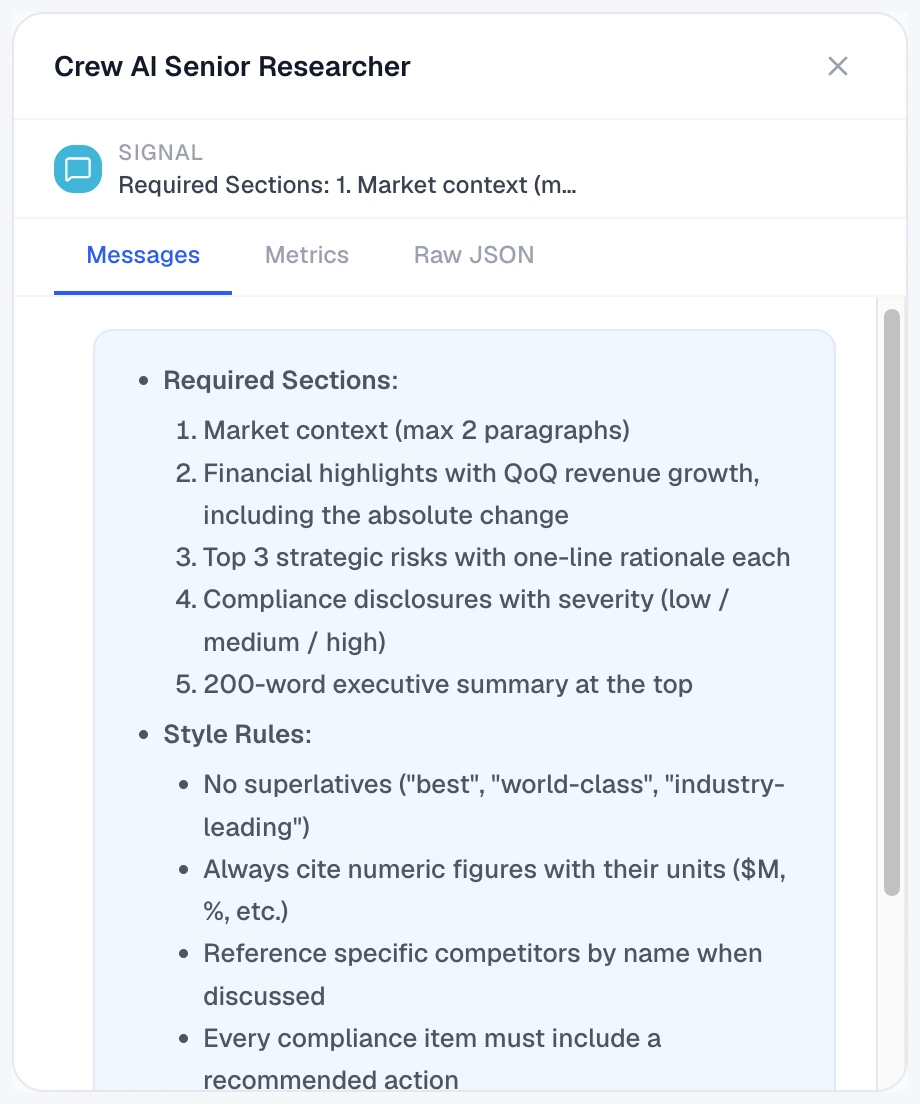
The right-hand pane has three tabs.
The pane is anchored on whichever agent or activity is currently selected, with that selection's label shown at the top (for example, LLM CALL https://api.openai.com/v1/chat/completions).
Messages
Inbound and outbound messages for the selected agent or activity. Each entry shows a From: or To: header naming the other party, followed by the message body. Tool calls and thinking entries get their own icons. Markdown formatting in the body is rendered.
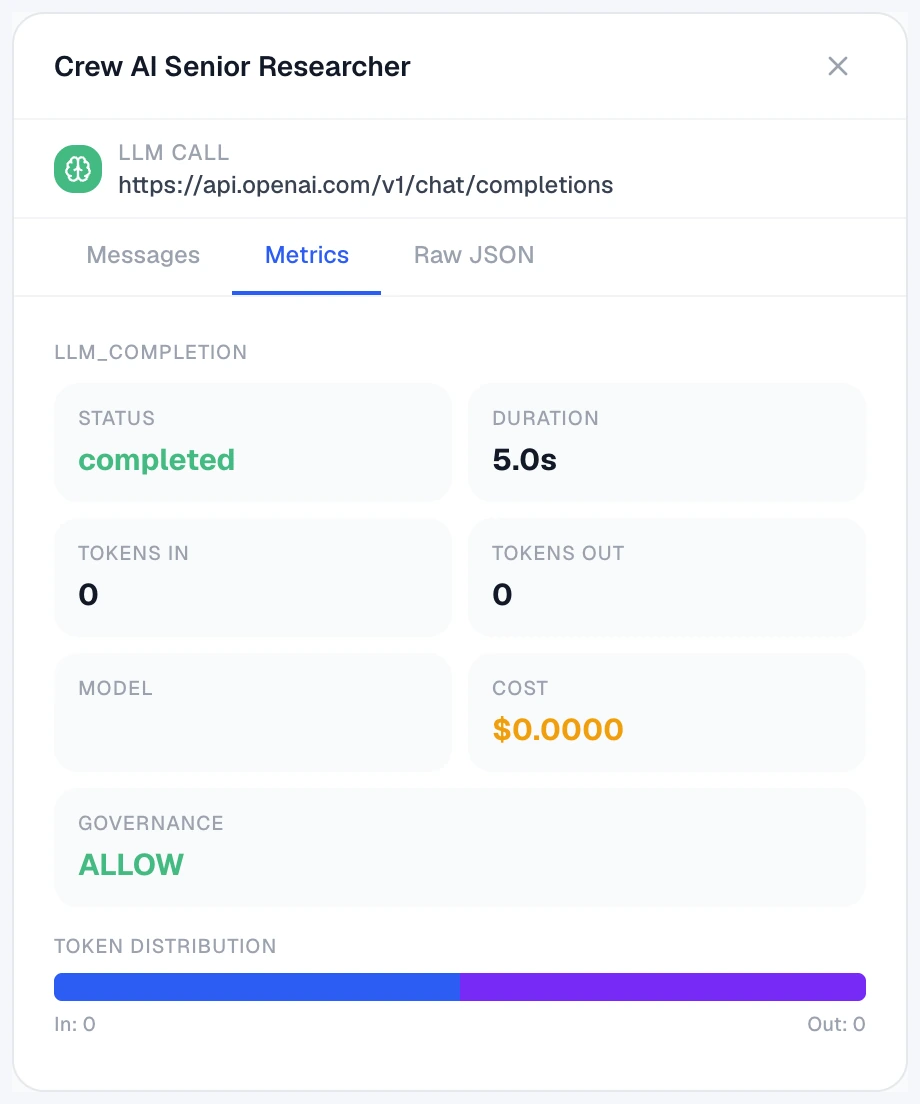
Metrics
Stats for the selected activity:
- Status and Duration
- Tokens in / Tokens out with a relative-distribution bar at the bottom
- Model
- Cost in USD
- Governance verdict (
ALLOW,BLOCK, orWARN)
The governance value is currently a label only — there's no graph or stream indicator that highlights a BLOCK verdict separately from an ALLOW. To investigate blocked operations, cross-reference the agent from the Agents page.
Raw JSON
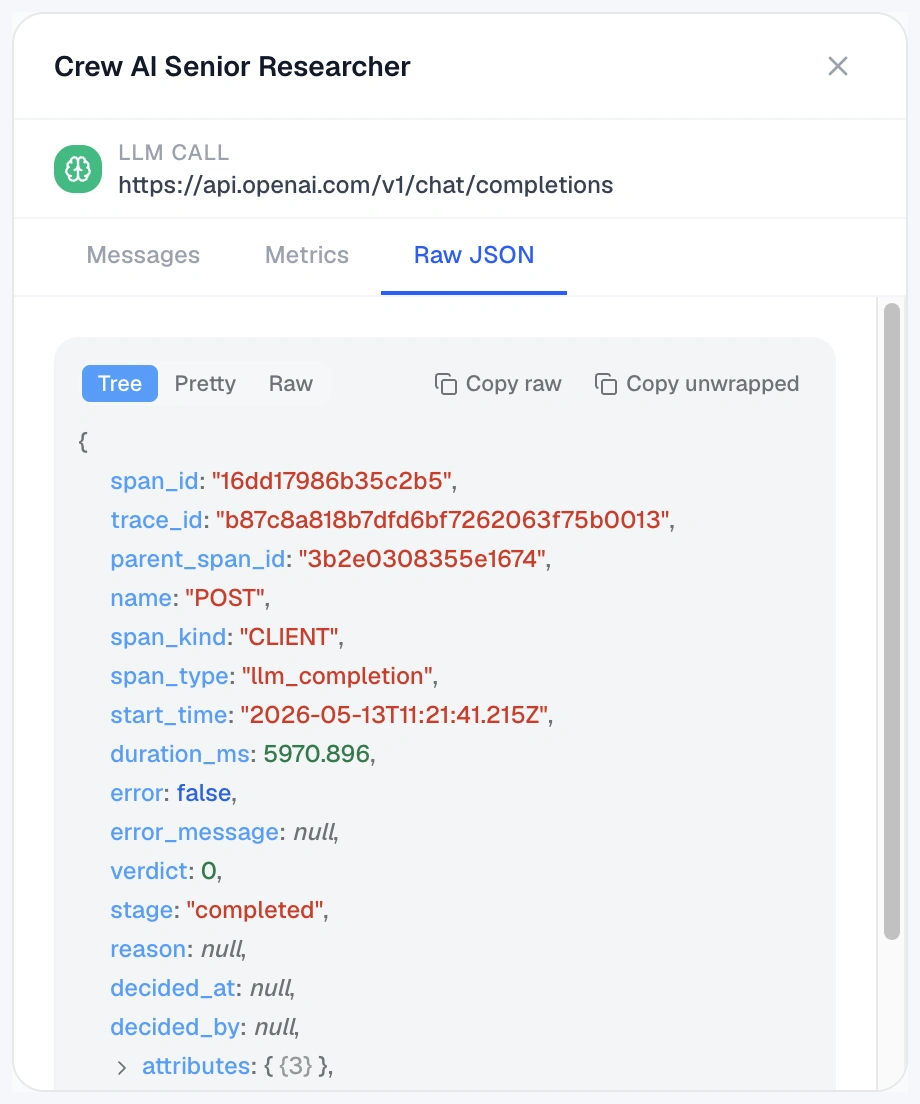
The raw payload for the selected activity. The view has three modes — Tree, Pretty, and Raw — plus Copy raw and Copy unwrapped buttons. Useful for spot-checking what the view is rendering against, or for copying IDs to look up from the Agents page.
Run states
| State | Meaning |
|---|---|
| Running | The run is still in progress; new activity may still appear |
| Completed | The run finished and every activity reported as complete |
| Failed | A session in the run errored, was blocked, or was halted |
If the run produced more activity than this view can display, an amber alert banner appears below the header: "This workflow has more activity than can be displayed. Showing the first 5000 events." Earlier activity still renders; later activity isn't shown.
Related
- Agents — per-agent sessions and event logs
- Approvals — reviewing approval requests across all agents (not surfaced in this view)
- Getting Started — wiring up an SDK that emits multi-agent runs